The Cost of Driving by State: Gas vs. Insurance
Gas now costs the average U.S. driver more each month than full-coverage insurance. Both bills side by side for every state and D.C., and which is bigger.
Summary
- The average U.S. driver spends about $208 a month on gas and $187 on full-coverage car insurance, $395 in all. With liability-only coverage instead, the total is about $307.
- The two bills have crossed. Regular gas averaged $4.33 a gallon in the week of October 12, $1.27 more than a year earlier, per the U.S. Energy Information Administration. Full coverage averaged $2,242 a year in September, slightly below the $2,258 of a year earlier, per Insurify's Data Center. A year ago the same driver spent about $147 a month on gas.
- Gas is now the bigger bill in 37 of the 50 states. Against liability-only coverage, gas is bigger everywhere except New Jersey, Rhode Island and D.C.
- The most expensive places to drive are Georgia ($504 a month), Maryland ($502) and Nevada ($486). The cheapest are New Hampshire ($258), Alaska ($287) and Ohio ($298).
- There are two kinds of expensive. In Maryland, Rhode Island and Delaware, insurance does it. In Mississippi, Missouri and Wyoming, it's the miles. Either way, the half you can shop is the insurance: compare quotes for your state before your renewal.
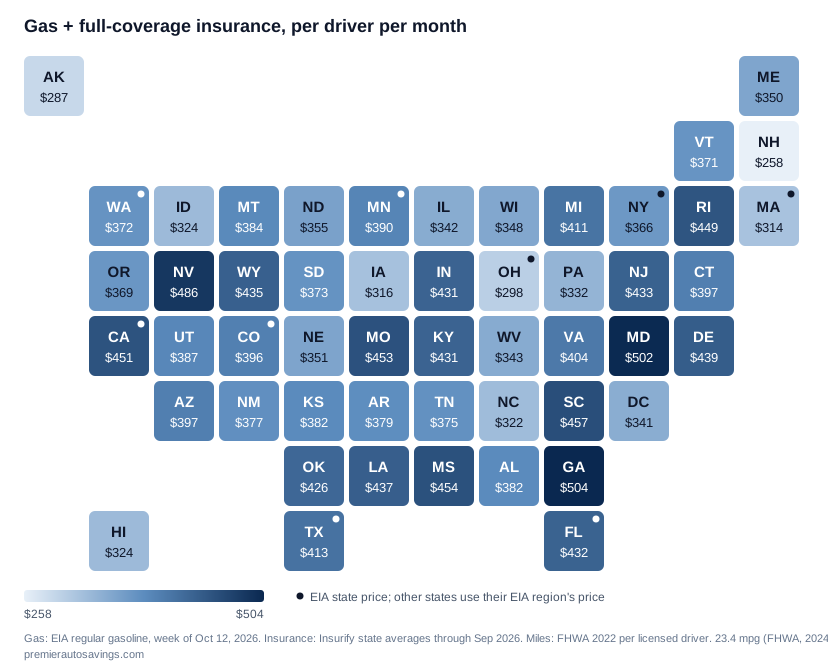
Darker tiles cost more. A dot marks the nine states the EIA prices individually; every other state uses its EIA region's price. Figures are per driver, per month.
Where driving costs the most
| State | Gas / mo | Full coverage / mo | Total |
|---|---|---|---|
| Georgia | $245 | $259 | $504 |
| Maryland | $200 | $302 | $502 |
| Nevada | $226 | $260 | $486 |
| South Carolina | $202 | $255 | $457 |
| Mississippi | $268 | $186 | $454 |
| Missouri | $273 | $180 | $453 |
| California | $248 | $203 | $451 |
| Rhode Island | $151 | $298 | $449 |
| Delaware | $177 | $262 | $439 |
| Louisiana | $228 | $209 | $437 |
Georgia tops the list on both counts at once: its drivers cover about 17,500 miles a year, among the most in the country, and pay $259 a month for full coverage. Maryland gets there on insurance alone. At $302 a month it's the most expensive state for full coverage in Insurify's data, with ordinary mileage. Nevada and South Carolina follow the same pattern as Maryland, insurance well above $250 with gas near the middle.
Mississippi and Missouri are the opposite case. Insurance there is close to the national average ($186 and $180), but drivers cover 18,500 to 19,500 miles a year, so gas runs $268 and $273 a month. California has the highest gas price the EIA reports, $6.10 a gallon, and lands seventh even though its drivers cover fewer miles than average.
Where driving costs the least
| State | Gas / mo | Full coverage / mo | Total |
|---|---|---|---|
| New Hampshire | $173 | $85 | $258 |
| Alaska | $190 | $97 | $287 |
| Ohio | $181 | $117 | $298 |
| Massachusetts | $177 | $137 | $314 |
| Iowa | $205 | $111 | $316 |
| North Carolina | $209 | $113 | $322 |
| Hawaii | $198 | $126 | $324 |
| Idaho | $217 | $107 | $324 |
| Pennsylvania | $170 | $162 | $332 |
| Washington, D.C. | $104 | $237 | $341 |
New Hampshire is cheapest by a distance, with the lowest insurance cost in the country ($85 a month for full coverage) and below-average mileage. Alaska and Ohio follow: Alaska on cheap insurance ($97), Ohio on the combination of one of the lowest gas prices EIA reports ($3.87) and $117 insurance. Massachusetts, Iowa and North Carolina all pair below-average insurance with ordinary gas bills.
Which bill is bigger where you live
Gas is the bigger bill in 37 states, mostly across the South, the Midwest and the Mountain West, where drivers cover the most ground. Wyoming's gas bill ($341 a month) is the highest in the table and its insurance ($94) among the lowest.
Insurance is the bigger bill in the other 13 states and D.C.: the Northeast corridor (Rhode Island, Maryland, Delaware, New Jersey, New York, Connecticut and D.C.) plus South Carolina, Michigan, Florida, Colorado, Nevada, Georgia and Virginia. In Virginia the two are almost even, $197 for gas and $207 for full coverage.
If you carry liability-only, the picture flips almost everywhere: gas is the larger bill in every state except New Jersey and Rhode Island, and in D.C. Our full coverage explainer covers what the step from liability to full coverage buys and what it costs by state.
Every state
| State | Gas / mo | Full coverage / mo | Gas + full | Liability / mo | Gas + liability |
|---|---|---|---|---|---|
| United States | $208 | $187 | $395 | $99 | $307 |
| Alabama | $240† | $142 | $382 | $66 | $306 |
| Alaska | $190† | $97 | $287 | $59 | $249 |
| Arizona | $235† | $162 | $397 | $91 | $326 |
| Arkansas | $229† | $150 | $379 | $73 | $302 |
| California | $248 | $203 | $451 | $98 | $346 |
| Colorado | $179 | $217 | $396 | $97 | $276 |
| Connecticut | $172† | $225 | $397 | $162 | $334 |
| Delaware | $177† | $262 | $439 | $166 | $343 |
| Florida | $196 | $236 | $432 | $142 | $338 |
| Georgia | $245† | $259 | $504 | $157 | $402 |
| Hawaii | $198† | $126 | $324 | $62 | $260 |
| Idaho | $217† | $107 | $324 | $64 | $281 |
| Illinois | $180† | $162 | $342 | $84 | $264 |
| Indiana | $303† | $128 | $431 | $64 | $367 |
| Iowa | $205† | $111 | $316 | $56 | $261 |
| Kansas | $225† | $157 | $382 | $79 | $304 |
| Kentucky | $237† | $194 | $431 | $121 | $358 |
| Louisiana | $228† | $209 | $437 | $106 | $334 |
| Maine | $211† | $139 | $350 | $74 | $285 |
| Maryland | $200† | $302 | $502 | $191 | $391 |
| Massachusetts | $177 | $137 | $314 | $103 | $280 |
| Michigan | $182† | $229 | $411 | $130 | $312 |
| Minnesota | $208 | $182 | $390 | $93 | $301 |
| Mississippi | $268† | $186 | $454 | $89 | $357 |
| Missouri | $273† | $180 | $453 | $92 | $365 |
| Montana | $245† | $139 | $384 | $62 | $307 |
| Nebraska | $217† | $134 | $351 | $69 | $286 |
| Nevada | $226† | $260 | $486 | $164 | $390 |
| New Hampshire | $173† | $85 | $258 | $52 | $225 |
| New Jersey | $176† | $257 | $433 | $181 | $357 |
| New Mexico | $244† | $133 | $377 | $65 | $309 |
| New York | $148 | $218 | $366 | $145 | $293 |
| North Carolina | $209† | $113 | $322 | $69 | $278 |
| North Dakota | $241† | $114 | $355 | $66 | $307 |
| Ohio | $181 | $117 | $298 | $65 | $246 |
| Oklahoma | $257† | $169 | $426 | $83 | $340 |
| Oregon | $213† | $156 | $369 | $91 | $304 |
| Pennsylvania | $170† | $162 | $332 | $90 | $260 |
| Rhode Island | $151† | $298 | $449 | $177 | $328 |
| South Carolina | $202† | $255 | $457 | $160 | $362 |
| South Dakota | $221† | $152 | $373 | $62 | $283 |
| Tennessee | $243† | $132 | $375 | $60 | $303 |
| Texas | $209 | $204 | $413 | $110 | $319 |
| Utah | $241† | $146 | $387 | $92 | $333 |
| Vermont | $231† | $140 | $371 | $57 | $288 |
| Virginia | $197† | $207 | $404 | $118 | $315 |
| Washington | $188 | $184 | $372 | $95 | $283 |
| Washington, D.C. | $104† | $237 | $341 | $136 | $240 |
| West Virginia | $187† | $156 | $343 | $83 | $270 |
| Wisconsin | $223† | $125 | $348 | $57 | $280 |
| Wyoming | $341† | $94 | $435 | $50 | $391 |
† Gas priced at the state's EIA region average (EIA prices nine states individually: California, Colorado, Florida, Massachusetts, Minnesota, New York, Ohio, Texas and Washington). Insurance figures are statewide averages for a driver aged 20–70 with a clean record and average or better credit.
What moves each half of the bill
Gas comes down to miles and mileage. At October's national price and the average fuel economy, every 1,000 fewer miles a year takes about $15 off a monthly gas bill. A car that gets 30 miles per gallon instead of 23.4 cuts the average driver's gas bill from about $208 to $162.
Insurance comes down to shopping and fit. The carrier spread inside one state is wide: in Oklahoma, liability-only runs from $39 to $135 a month depending on the company. Our state guides, linked in the table above, show that spread carrier by carrier. If you drive well under your state's average, a mileage-based policy can price that in; our pay-per-mile comparison covers the four main programs and where the break-even sits. And if the car is paid off, the liability-to-full step is worth re-checking every year.
The gas half moves weekly and the insurance half moves at renewal, so the renewal notice is the moment to act on. Check what you'd pay today for the coverage you actually need, then compare it with what's on the notice.
How we calculated this
Gas per month is each state's average annual miles per licensed driver, divided by an average fuel economy of 23.4 miles per gallon, divided by 12, times the week's regular gasoline price. Insurance is each state's average monthly cost for full coverage and for liability-only. The total is the two added together. Everything is per driver, per month.
Three limits are worth knowing. The mileage figure divides all the vehicle miles driven in a state by its licensed drivers, so states with heavy through-traffic, Wyoming and Indiana especially, may show more miles than a typical household drives. The EIA prices only nine states individually, so the other 41 and D.C. carry their region's average price and are marked †. And every figure is an average; your own bills depend on your car, your commute and your record. Our monthly rate report tracks the insurance half month to month.
Gas prices per the U.S. Energy Information Administration's Gasoline and Diesel Fuel Update, regular gasoline, all formulations, including taxes, week of October 12, 2026 (released October 14); year-ago change per the same release. EIA regions: New England, Central Atlantic and Lower Atlantic (East Coast), Midwest, Gulf Coast, Rocky Mountain, and West Coast less California for Alaska, Arizona, Hawaii, Nevada and Oregon. Insurance per Insurify's Average Car Insurance Rates as of October 2026 (published October 8, 2026; Insurify price data through September 2026; drivers aged 20–70 with clean records and average or better credit); national annual figures per Insurify's Auto Insurance Data Center (September 2026 and September 2025). Annual miles per licensed driver by state per Insurify's Average Miles Driven Per Year, citing the Federal Highway Administration's 2022 data. Fuel economy per FHWA Highway Statistics 2024, Table VM-1, all light-duty vehicles. Calculations are ours; figures are rounded to the dollar. Actual costs vary by driver.